Request logs
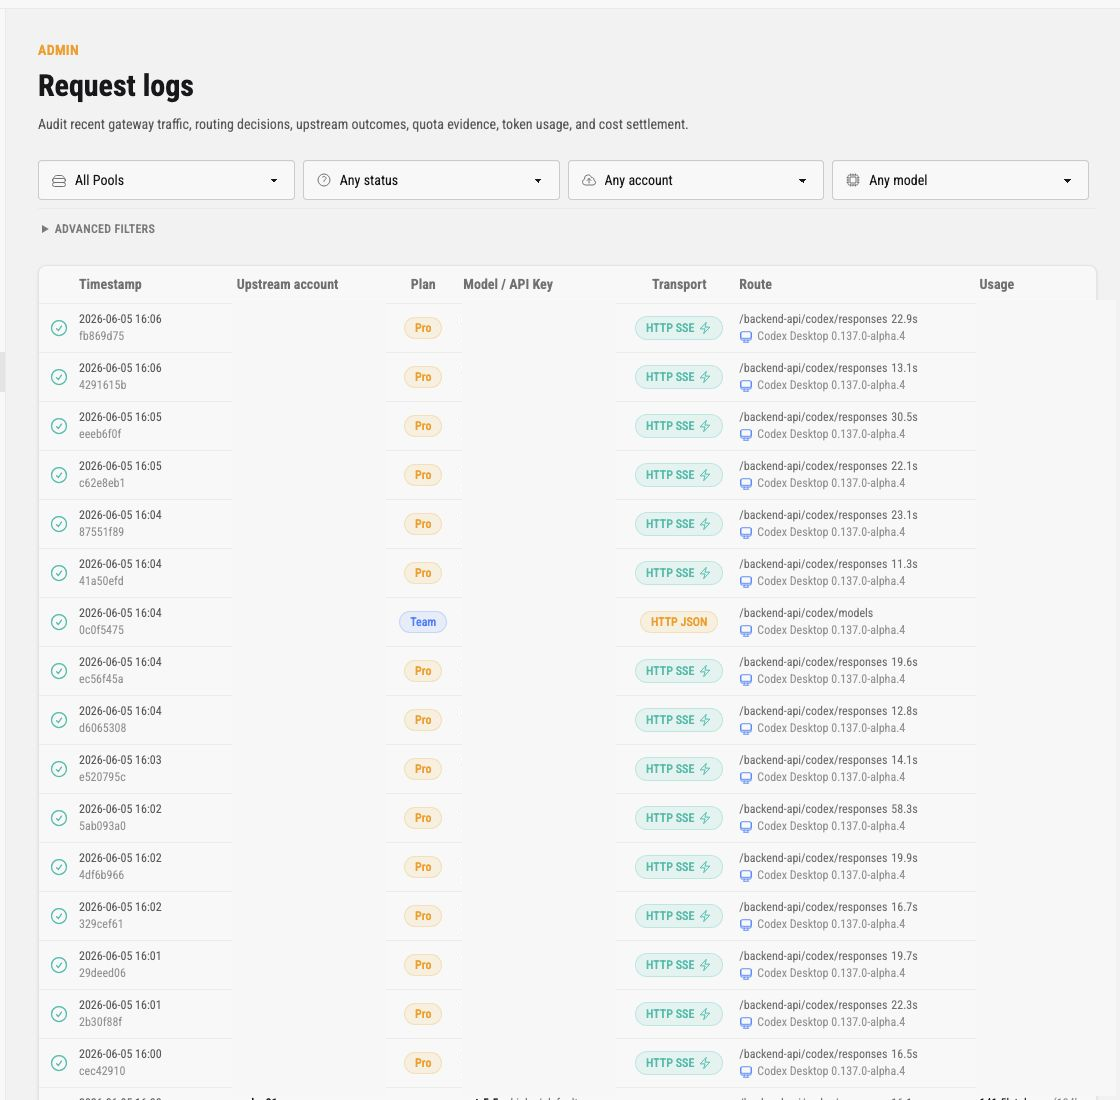
The Request logs page is the operator surface for recent runtime traffic. It helps you inspect whether requests were admitted, which Pool handled them, which upstream account was selected, how the route behaved, and what usage metadata was settled.
Use this page when you need to answer:
- whether a client request reached Codex Pooler
- which Pool, upstream account, model, API key, and transport were involved
- whether the request succeeded, failed, retried, or is still in progress
- how long routing and upstream work took
- which token and cost metadata was recorded
- whether errors were safe operational errors, quota issues, or upstream failures
Request logs are metadata-only. They do not show prompt text, generated content, uploaded file bytes, media contents, websocket frames, bearer tokens, upstream credentials, raw Pool API keys, raw idempotency keys, or raw provider payloads.
The screenshots in this guide redact live row values. The production UI shows safe labels and prefixes for operators, but public docs should not publish production identifiers or usage totals.
Filters
Section titled “Filters”The top filters narrow the table without changing any data.
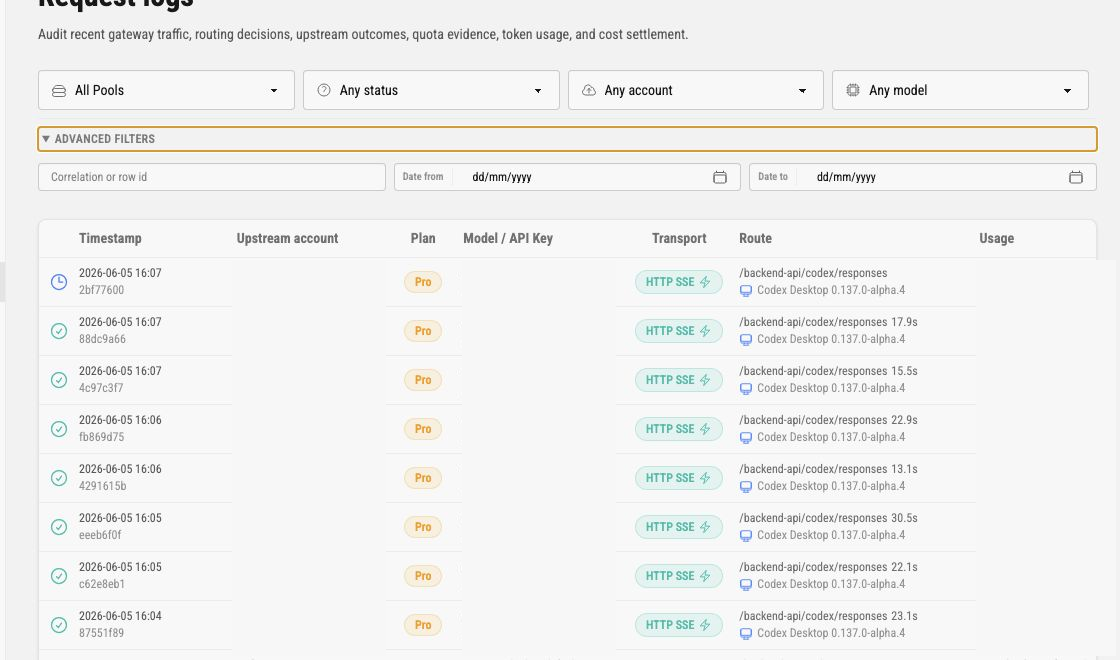
Primary filters are:
| Filter | Meaning |
|---|---|
| Pool | Limits rows to one Pool. Owners can inspect all visible Pools; assigned admins only see their Pool scope. |
| Status | Limits rows by request outcome, such as completed, failed, rejected, or in-progress states. |
| Upstream account | Limits rows to a visible upstream identity. When a Pool is selected, this list narrows to accounts assigned to that Pool. |
| Model | Limits rows to a model name observed in request logs. |
Advanced filters are:
Correlation or row id, for finding one request by known idDate from, for the start of the time rangeDate to, for the end of the time range
Invalid or unsupported filters are ignored with a warning so operators can fix the query without losing the page.
Table Columns
Section titled “Table Columns”The table shows the latest matching rows, with a hard page size limit.
| Column | Meaning |
|---|---|
| Status icon | Outcome indicator for the request row. Use the icon with the Errors column to understand failures. |
| Timestamp | Admission time and short row id. Use this when correlating with logs, audit events, or client reports. |
| Upstream account | Selected upstream account label and Pool name when selection metadata is visible. |
| Plan | Safe upstream plan badge when known. |
| Model / API Key | Requested or enforced model, reasoning and service tier, plus the API key label or safe prefix. |
| Transport | Request transport and protocol family, such as HTTP JSON or HTTP SSE. |
| Route | Runtime route family and safe client metadata. It can include path shape and latency, not request content. |
| Usage | Settled token and cost metadata when available. Missing usage can mean the request did not settle or pricing was unavailable. |
| Errors | Sanitized error summary lines. These should identify operational cause without exposing content or credentials. |
Status and Errors
Section titled “Status and Errors”Use status and errors together. A completed row with token usage usually means the request reached an upstream and settled successfully. A failed row may still show route, latency, or partial attempt metadata. A rejected row usually means admission or policy failed before upstream work.
OpenAI Responses response.incomplete can be a successful delivered terminal response. For example, an upstream may stop at max_output_tokens or a content filter and still return safe usage metadata. Those rows stay succeeded and should not be treated as upstream health failures. Error-coded incomplete terminals, stale continuation anchors, stream truncation, and client disconnects still appear as failures or interruptions with sanitized error codes.
Common causes to inspect are:
- Pool API key paused, revoked, expired, or attached to the wrong Pool
- requested model not allowed by the key policy
- no active upstream assigned to the Pool
- selected upstream needing reauthorization or token refresh
- quota evidence exhausted or stale
- upstream route failure or timeout
- request shape unsupported by the current compatibility surface
The Errors column should stay safe to copy into operator tickets. It should not include raw prompts, responses, uploaded file contents, credentials, or provider payloads.
Usage Metadata
Section titled “Usage Metadata”Usage lines summarize request accounting, including request count context, token totals, cached input tokens, and estimated cost when pricing is available. Treat these as operational attribution and capacity evidence. They are not a replacement for provider billing records.
If usage is blank, check the request status first. A request can be admitted without final usage if it failed before settlement, if pricing was not matched, or if accounting metadata was not available for that route. A delivered incomplete response with missing upstream usage remains usage_unknown and does not get an invented settled cost from the reservation estimate.
Operational Checklist
Section titled “Operational Checklist”When investigating a client report, check request logs in this order:
- filter by Pool or API key context if known
- filter by request id when the client provided one
- narrow by model or upstream only after confirming the Pool
- inspect status, transport, route, and errors
- compare timestamps with Audit logs for recent policy or lifecycle changes
- open the Pool page to confirm active status and assignments
- open the Upstreams page to confirm readiness, quota, and freshness
- open API keys to confirm key policy, status, expiry, and limits
If no row exists, the request may not have reached Codex Pooler, may have used a different Pool API key, or may be outside the visible operator scope.