Monitoring and runtime triage
Codex Pooler exposes Prometheus metrics at /metrics. Metrics auth is managed from /admin/system; if a bearer token is configured, Prometheus must scrape with the matching Kubernetes Secret reference instead of putting the raw token in Helm values.
Use monitoring for runtime evidence only. Dashboards, alerts, logs, tickets, and copied queries must not include prompts, response bodies, uploaded files, websocket frames, cookies, bearer tokens, upstream secrets, or raw Pool API keys.
Collector path
Section titled “Collector path”The Helm chart can render a Prometheus Operator ServiceMonitor for the app service:
monitoring: serviceMonitor: enabled: true labels: release: kube-prometheus-stack interval: 10s scrapeTimeout: 5sThe release label and scrape interval should match your own Prometheus Operator selectors and scrape budget. For fast OOM investigations, prefer a short interval for the app ServiceMonitor and keep broader Kubernetes collectors at their normal cadence. Worker and scheduler roles don’t start the Prometheus reporter because they don’t expose /metrics; use Kubernetes cgroup metrics and sampler logs for those pods.
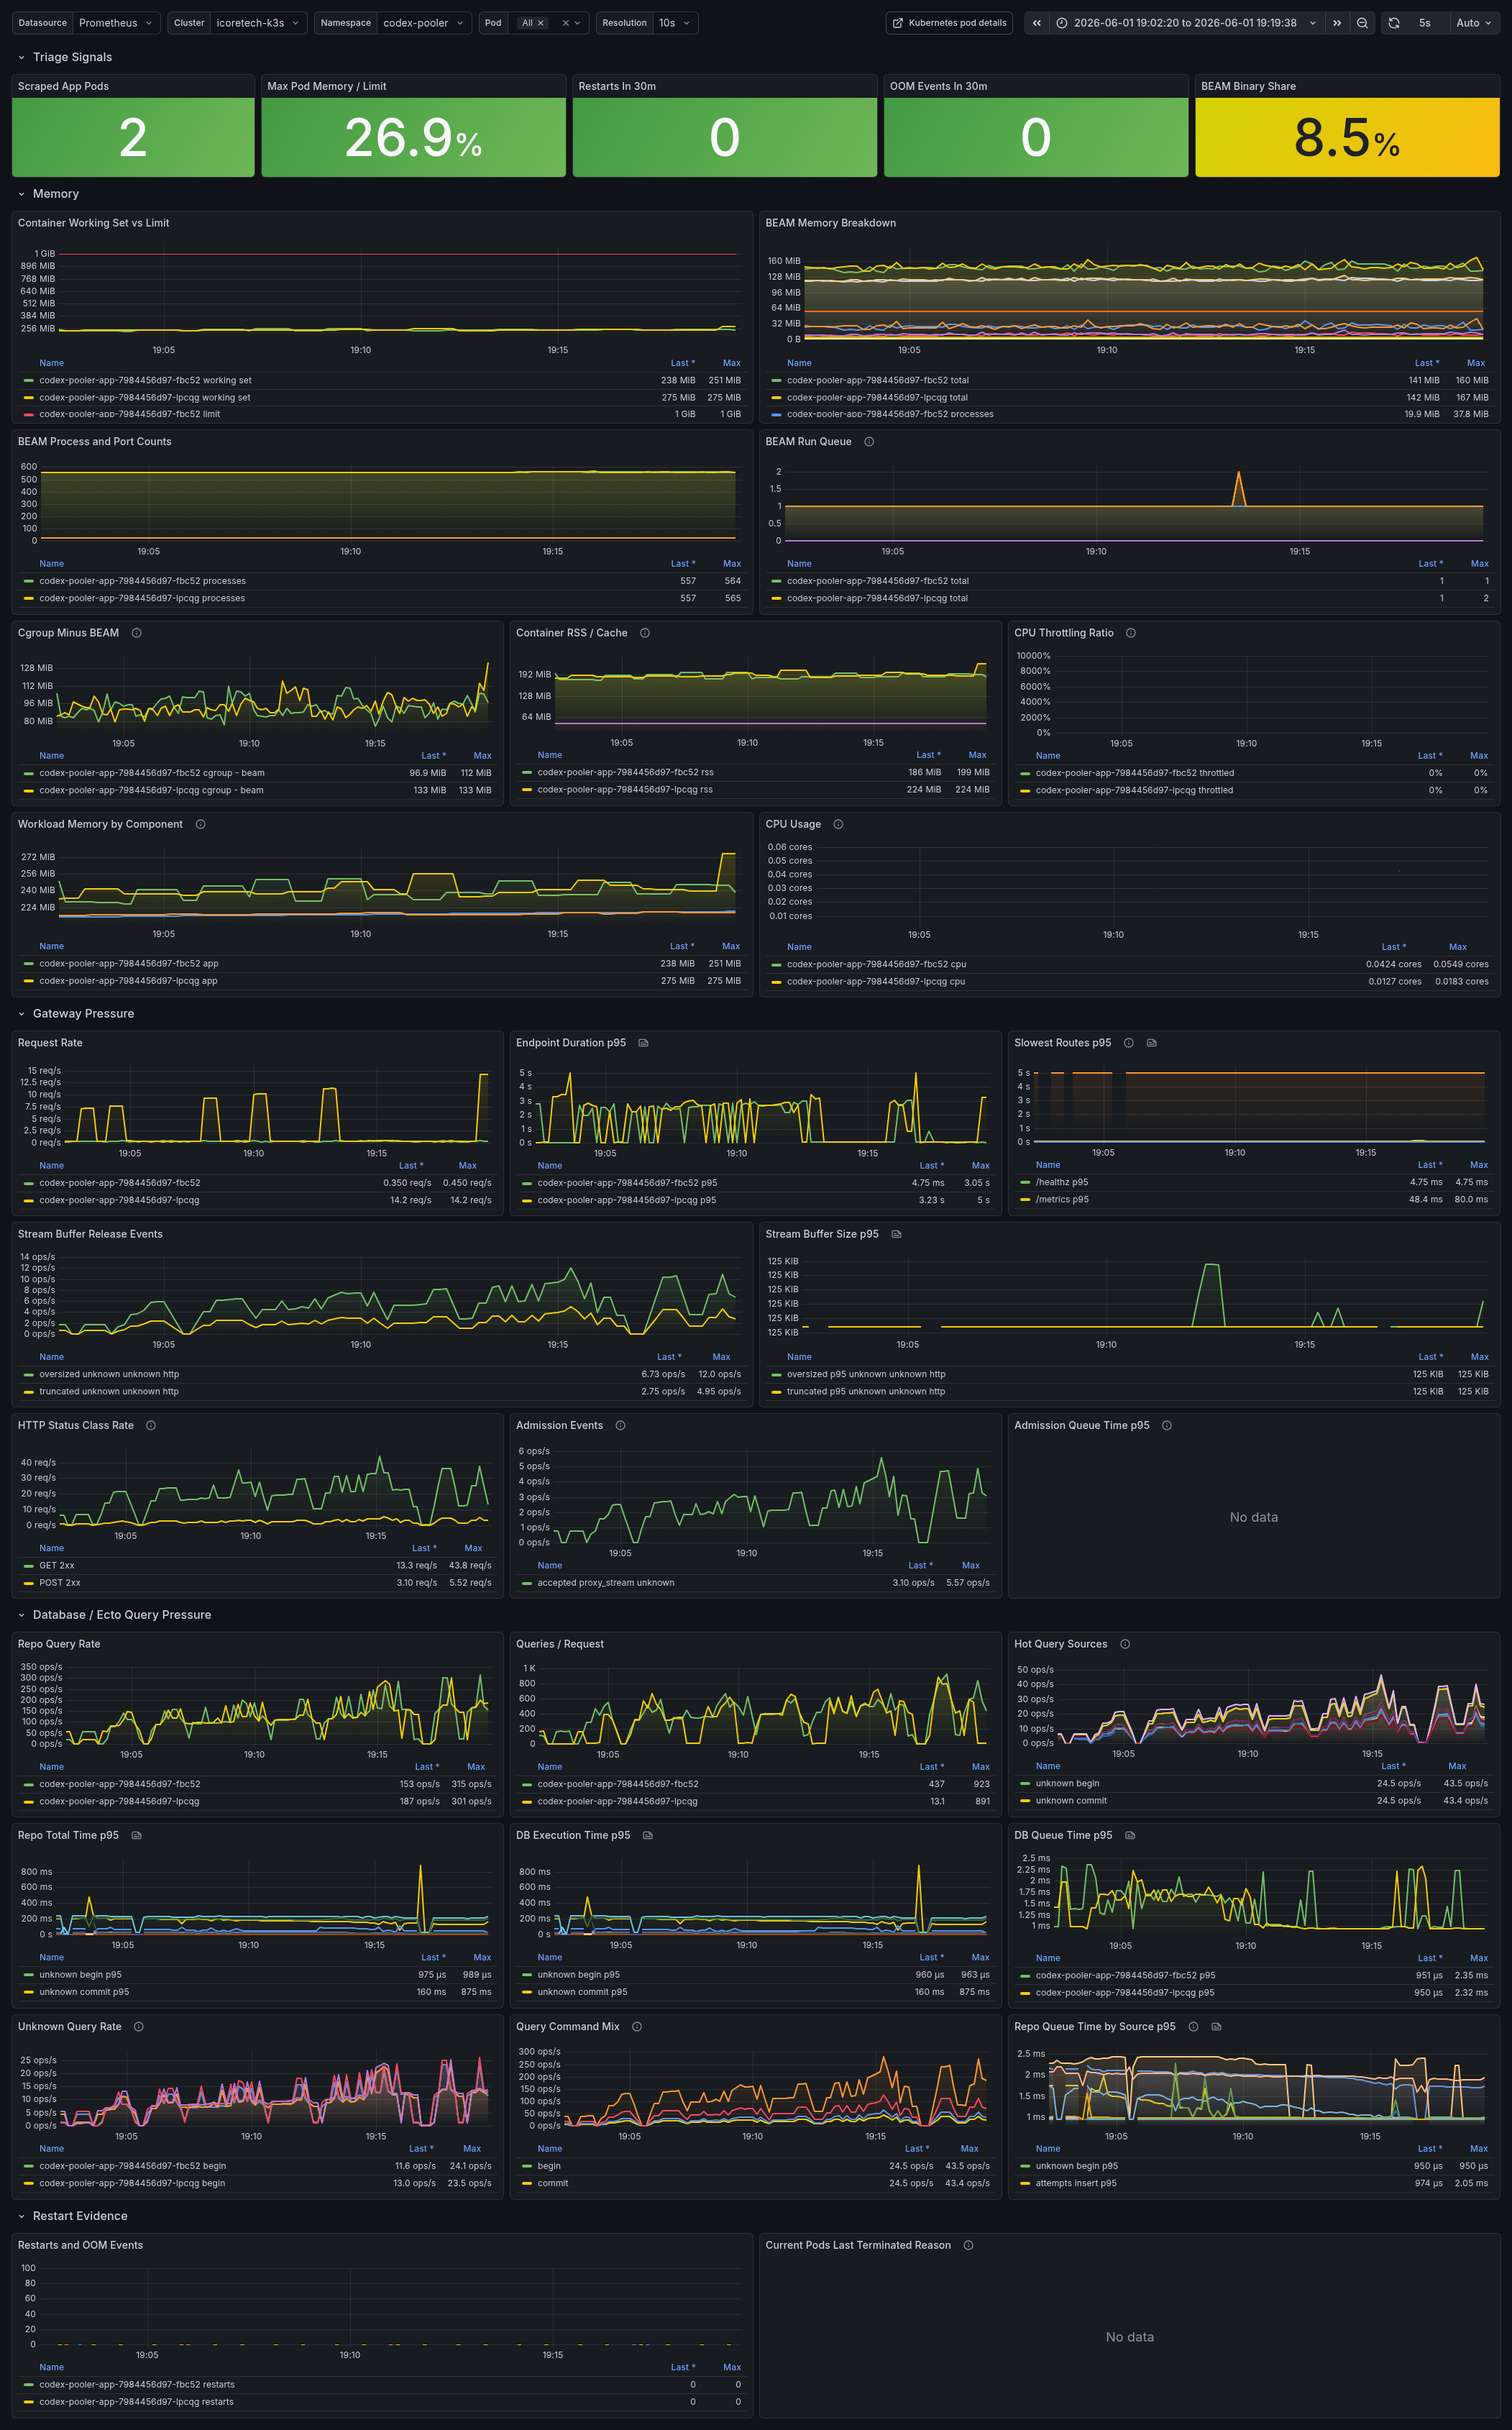
Runtime triage dashboard
Section titled “Runtime triage dashboard”Build your Grafana or Prometheus dashboard around the signals needed to correlate runtime pressure across memory, request handling, gateway admission, database access, and restarts:
- Kubernetes cgroup working set versus pod memory limit, RSS/cache split, and cgroup memory not explained by BEAM total
- BEAM memory total, processes, binary, ETS, code, atom, atom used, and system memory by pod
- BEAM process count, port count, total run queue, CPU run queue, and IO run queue
- app restarts, OOM events, and current pod last terminated reason
- request rate, HTTP status class rate, and p95 endpoint/router latency
- gateway admission accepted, queued, rejected, timed-out, and queue-time p95 signals
- stream-buffer oversized and truncated events
- Ecto query rate, queries per request, hot query sources by safe source and SQL command, unknown query rate, and DB queue p95
Read the dashboard as a correlation view. If cgroup memory climbs while BEAM total stays flat, look outside normal BEAM heap attribution. If vm_memory_binary_bytes climbs with cgroup memory, inspect streaming response retention, file bodies, and upstream transport buffering. If process count, ports, or run queue climb, inspect stuck request processes, websocket ownership, and overloaded route classes.
Download the starter Grafana dashboard JSON
Useful PromQL
Section titled “Useful PromQL”max by (pod) ( container_memory_working_set_bytes{namespace="codex-pooler", container="app", image!=""})vm_memory_total_bytes{namespace="codex-pooler", job="codex-pooler-app"}vm_memory_binary_bytes{namespace="codex-pooler", job="codex-pooler-app"}vm_memory_processes_bytes{namespace="codex-pooler", job="codex-pooler-app"}vm_memory_ets_bytes{namespace="codex-pooler", job="codex-pooler-app"}vm_memory_system_bytes{namespace="codex-pooler", job="codex-pooler-app"}clamp_min( max by (pod) ( container_memory_working_set_bytes{ namespace="codex-pooler", container="app", image!="" } ) - on (pod) max by (pod) ( vm_memory_total_bytes{namespace="codex-pooler", job="codex-pooler-app"} ), 0)increase(kube_pod_container_status_restarts_total{ namespace="codex-pooler", exported_container="app"}[15m])rate(codex_pooler_gateway_stream_buffer_oversized_count_total[5m])rate(codex_pooler_gateway_stream_buffer_truncated_count_total[5m])sum by (pod) ( rate(codex_pooler_repo_query_count{namespace="codex-pooler", job="codex-pooler-app"}[5m]))topk(10, sum by (source, command) ( rate(codex_pooler_repo_query_count{namespace="codex-pooler", job="codex-pooler-app"}[5m]) ))sum by (pod, command) ( rate(codex_pooler_repo_query_count{ namespace="codex-pooler", job="codex-pooler-app", source="unknown" }[5m]))histogram_quantile(0.95, sum by (le, source, command) ( rate(codex_pooler_repo_query_total_time_seconds_bucket{ namespace="codex-pooler", job="codex-pooler-app" }[5m]) ))sum by (method, status_class) ( rate(codex_pooler_http_request_count{ namespace="codex-pooler", job="codex-pooler-app" }[5m]))sum by (route_class, transport) ( rate(codex_pooler_gateway_admission_enqueued_count{ namespace="codex-pooler", job="codex-pooler-app" }[5m]))histogram_quantile(0.95, sum by (le, route_class, transport) ( rate(codex_pooler_gateway_admission_dequeued_time_seconds_bucket{ namespace="codex-pooler", job="codex-pooler-app" }[5m]) ))histogram_quantile(0.95, sum by (le, pod) ( rate(codex_pooler_repo_query_queue_time_seconds_bucket{ namespace="codex-pooler", job="codex-pooler-app" }[5m]) ))Memory sampler logs
Section titled “Memory sampler logs”The in-process memory sampler is enabled by default in every release role. When BEAM total memory or cgroup usage crosses the configured threshold, it logs a sanitized snapshot with role metadata, memory categories, cgroup memory stats, process and port counts, top processes by memory, top processes by message queue length, and top ETS tables by memory. It never logs ETS table contents, messages, request bodies, prompts, bearer tokens, websocket frames, or upstream payloads.
Emergency tuning environment variables:
CODEX_POOLER_MEMORY_SAMPLER_ENABLED=trueCODEX_POOLER_MEMORY_SAMPLER_THRESHOLD_RATIO=0.70CODEX_POOLER_MEMORY_SAMPLER_MIN_INTERVAL_MS=60000CODEX_POOLER_MEMORY_SAMPLER_TOP_PROCESSES=20CODEX_POOLER_MEMORY_SAMPLER_TOP_ETS_TABLES=20CODEX_POOLER_MEMORY_SAMPLER_LIMIT_BYTES=1073741824Use a lower threshold or shorter interval only during active investigation, because logs are the only signal likely to capture a worker or scheduler spike that reaches OOM before the next Prometheus scrape. Worker and scheduler pods do not expose the app /metrics endpoint and do not start the Prometheus reporter, so combine their sampler logs with Kubernetes cgroup memory, restart, OOM, and memory-limit metrics.